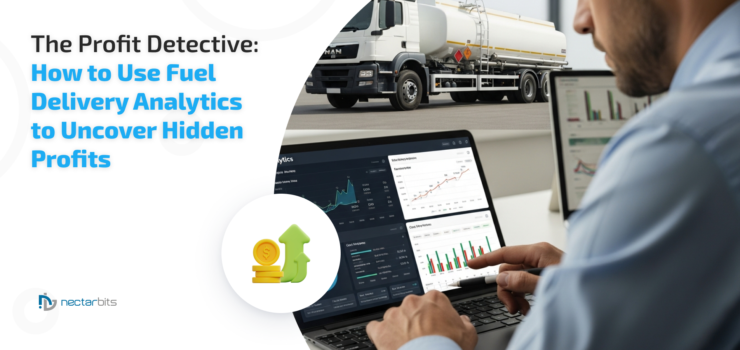
In the fuel delivery business, profits are won and lost in the margins. You operate in a world of volatile fuel prices, intense competition, and complex logistics where every minute and every mile counts. You might think you have a good handle on your costs, but what if your business is silently leaking profits from a dozen hidden places every single day? Inefficient routes, excessive vehicle idling, underperforming drivers, and even certain “valuable” customers could be secretly draining your bottom line.
Running your business on gut feelings and basic spreadsheets is like trying to solve a crime without any evidence. You need a magnifying glass. You need to become a “Profit Detective.” Your primary tool? Fuel Delivery Analytics Software.
This isn’t just another dashboard. It’s an investigation board that collects clues from every corner of your operation—your vehicles, your drivers, your customers, your routes—and presents them as actionable intelligence. This guide will show you how to use this powerful tool to investigate your own business, find the culprits behind profit loss, and ultimately improve profitability in fuel delivery.
The Crime Scene: Where Your Profits Are Secretly Leaking
Before you can solve the case, you need to identify the crime scene. For a fuel delivery business, profits don’t vanish in a single dramatic heist; they bleed out slowly through common, often-overlooked inefficiencies.

Here are the lead suspects in the case of the missing profits:
- Suspect #1: The Inefficient Route. Your drivers might be taking longer, more fuel-intensive routes out of habit or due to a lack of real-time information. Every extra mile is a direct cost in fuel, wages, and vehicle wear and tear. The US Department of Energy states that poorly planned routes can increase fuel consumption by up to 25%.
- Suspect #2: The Idle Threat. A truck that’s idling is literally burning money. Whether a driver is waiting at a client site, taking an extended break, or stuck in preventable traffic, that engine is consuming fuel with zero productive output. An idling heavy-duty truck can burn nearly one gallon of fuel per hour, a cost that multiplies quickly across an entire fleet.
- Suspect #3: The Unprofitable Client. Not all revenue is good revenue. A high-volume client located far from your other stops, with difficult site access and long wait times, might actually be costing you money on every delivery. Without data, you have no way of knowing which clients are your stars and which are draining your resources.
- Suspect #4: The Inconsistent Performer. Driver behavior has a massive impact on fuel efficiency and safety. Aggressive driving—hard braking, rapid acceleration—can lower fuel economy by 15% to 30% at highway speeds. Without objective data, identifying and coaching these behaviors is impossible
The Detective’s Toolkit: What is Fuel Delivery Analytics Software?
Fuel Delivery Analytics Software is the central intelligence hub for a data-driven fuel delivery business. It goes far beyond simple GPS tracking by collecting, processing, and visualizing data from your entire operation, turning raw numbers into clear fuel delivery performance insights.
Think of it as a complete detective’s kit:
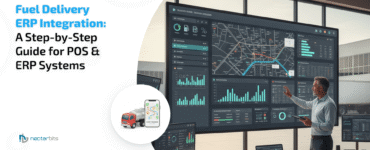
- The Central Dashboard (The Investigation Board): This is your mission control. It provides a high-level, visual overview of your key performance indicators (KPIs)—total fuel delivered, miles driven, average delivery time, fleet fuel efficiency, and more.
- Telematics Data (The Forensic Evidence): This is the raw data collected from your vehicles’ GPS and OBD-II ports. It provides the hard evidence: vehicle location, speed, engine status (on/off/idling), fuel levels, and diagnostic trouble codes.
- Route Analysis Reports (The Map with Pins): These reports overlay your planned routes against the actual routes taken by drivers. They instantly reveal deviations, unplanned stops, and inefficient paths.
- Driver Scorecards (The Suspect Profiles): This tool creates objective profiles for each driver based on metrics like idling time, speeding events, hard braking, and on-time performance.
- Customer Profitability Analysis (Following the Money): This powerful feature combines delivery data (time on site, distance traveled) with financial data (revenue per delivery, cost to serve) to reveal the true profitability of each customer, job, or region.
Solving the Cases: How to Optimize Fuel Delivery Operations with Data
Now that you have your toolkit, let’s solve the cases and recover your lost profits.
Case #1: The Mystery of the Wasted Miles
The Clue: Your monthly fuel expenses are consistently higher than projected, even when fuel prices are stable.
The Investigation: Use the route analysis report in your Fuel Delivery Analytics Software. Compare the optimized routes generated by your planning software with the actual “breadcrumb” trails of your drivers.
The Discovery: You find that one of your drivers consistently takes a longer highway loop instead of a more direct arterial road to avoid two traffic lights, adding 7 miles to a daily route. Another driver regularly makes an unauthorized 15-minute stop at a coffee shop far off his route.
The Action:
- Review the inefficient routes with drivers, using the data maps as a visual aid for coaching.
- Set up real-time alerts for route deviations to address issues as they happen, not weeks later.
- Use the historical data to continuously refine your master routes for maximum efficiency.
Case #2: The Idling Epidemic
The Clue: Your fleet’s overall MPG is dropping, and drivers are reporting needing to refuel more often.
The Investigation: Pull up the “Idling Report” from your analytics dashboard. This report ranks every vehicle and driver by total idling time.
The Discovery: You find that three trucks in your fleet account for 60% of total idling time. One driver consistently leaves the truck running for his entire 45-minute lunch break. Another regularly arrives at a client site 30 minutes early and idles while waiting for their gate to open.
Table: The True Cost of Excessive Idling (Example for One Truck)
| Metric | Daily | Monthly (22 days) | Annually |
| Excessive Idling Time | 1.5 hours | 33 hours | 396 hours |
| Fuel Wasted (@ 0.8 gal/hr) | 1.2 gallons | 26.4 gallons | 316.8 gallons |
| Annual Cost (@ $4.50/gallon) | $5.40 | $118.80 | $1,425.60 |
The Action:
- Implement a company-wide policy on idling limits.
- Use the driver scorecards to set goals and incentivize drivers who show the most improvement.
- Adjust dispatch schedules for the driver who arrives too early, saving both time and fuel.
Case #3: The Unprofitable “VIP” Client
The Clue: Your team is always stressed about serving “Client X,” a large construction company, but the revenue looks great on paper.
The Investigation: Run a customer profitability report. Your Business Analytics Software pulls all the data associated with Client X: travel distance for each delivery, average time spent on-site (including wait times), and the revenue per gallon.
The Discovery: The data reveals a shocking truth. Client X’s site is remote, requiring a 40-mile round trip. Worse, your drivers spend an average of 55 minutes on-site waiting for a foreman to grant access, compared to a fleet-wide average of 20 minutes. When you factor in the driver’s wages and the cost of the truck’s time, you are actually making a net loss on each delivery.
Table: Customer Profitability Analysis Example
| Metric | Client X (The “VIP”) | Client Y (Smaller Business) |
| Avg. Delivery Volume | 1,500 gallons | 500 gallons |
| Avg. Revenue | $6,750 | $2,250 |
| Cost to Serve (Fuel, Wages, Time) | $6,850 | $1,900 |
| Net Profit / Loss | -$100 (Loss) | +$350 (Profit) |
The Action:
- Renegotiate the contract with Client X. Use the data to justify a “wait time” fee or a higher price per gallon to make the account profitable.
- Work with Client X’s management to establish a smoother check-in process to reduce driver wait times.
- If they are unwilling to adjust, you now have the data to make an informed decision to potentially fire an unprofitable customer and focus resources on profitable ones like Client Y.
Conclusion: From Detective to Architect of Profitability
Being a “Profit Detective” isn’t a one-time investigation. It’s about cultivating a data-driven fuel delivery business culture. The insights you gain from Fuel Delivery Analytics Software do more than just solve today’s problems; they allow you to predict and prevent future ones. You can anticipate vehicle maintenance needs, forecast fuel demand more accurately, and design sales territories that are inherently more profitable.
Stop letting hidden inefficiencies rob you of your hard-earned profits. By embracing the role of the Profit Detective and equipping yourself with the right analytics tools, you can move beyond simply running your business to intelligently engineering its success. The data holds all the clues—all you have to do is look.
Recommended Reading
Now that you know how to find inefficiencies, want to learn how to prevent them from the start? Discover how advanced route planning software can save you money before your trucks even leave the depot.
Read More: Route Planning Software: Fuel Your Business by Saving on Fuel Costs
FAQs:
It helps identify hidden inefficiencies—like fuel wastage, unnecessary idling, or poor route planning—and converts that data into actionable insights. By optimizing these areas, businesses can lower operating costs and boost overall profitability.
It collects telematics, GPS, and operational data such as fuel usage, driver behavior, route efficiency, and delivery times. These insights help managers understand performance trends and make smarter, faster business decisions.
Yes. Modern analytics tools are scalable and cloud-based, making them ideal even for small fleets. They help smaller operators reduce costs, improve delivery efficiency, and compete effectively with larger players
Fleet tracking tells you where your vehicles are. Fuel Delivery Analytics Software goes further—it links operational data with financial outcomes, showing which routes, drivers, or customers truly impact your bottom line.